Dashboard and KPIs
Customizing your KPIs display
It is possible to personalize the display of graphs or charts for demographic data or rates and trends.
Customize the Display
Go to Reports > KPI and select the Demographics or Rates and Trends tab.
Regardless of the tab selected, click on the menu icon in the upper right corner of the page.
Check or uncheck the information you wish to display or hide.
By default, all charts are displayed (and therefore selected).
💡 Tip: Your selection will be saved for your future logins. You will not have to customize every time.
Demographics - % Full-Time or Part-Time
What is taken into account for the calculation in the “% full-time” and “% part-time” tables in the reports?
The data used for the % full-time and % part-time results are taken from employee profiles. More specifically, what is entered in the employment type field. Only the types “full-time” and “part-time” choices will be taken into account. All other options available in this field will have no impact on this statistic.
👉 Please note: KPIs are updated only once, on the first of each month, for the previous month only. If you make retroactive changes after this, the data will not be recalculated and these changes will have no impact on the KPIs already displayed.
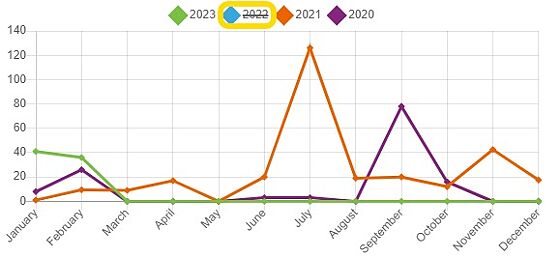
KPI - Compare multiple years
It is possible to view multiple years within the statistics charts. To select the number of years to be displayed in the tables, both in the Demographics and the Rates and Trends section, click on the Number of years displayed drop-down.
If you select more than one year, the rows of the tables will adjust accordingly with different colors.
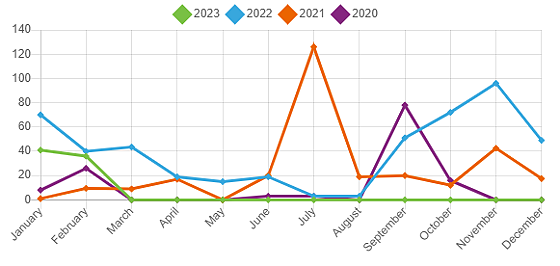
It is possible to hide one or more years. Click on the year(s) to be hidden inside the table and click one more time to display them again.
Notification and Reminder Center features (Home page)
The Notification and Reminder Center presents you with a summary of relevant information and task reminders.
A user with access to view information on employees other than himself will have the option of having a Global View (see information on all employees to whom he has access) or a Me View (visibility on my own information only). The view can be changed using this button:
Global View
The first section with the yellow rectangles shows you statistics on the total number of hours used since the beginning of the month in each of the time management modules (Absences, Holidays and Overtime).
The Today section shows you employees on any type of leave, employees starting or ending their employment, and birthdays or anniversaries as of today's date. You can change the date displayed for this information by selecting another date in the Calendar.
The Calendar section uses colored dots to display days with one or more of the items in the Today section, in addition to public holidays. By selecting a day other than today, you affect what is shown in the Today section.
The Ongoing processes section shows you the onboarding or offboarding processes you have the opportunity to view, or for which you have one or more tasks to complete. This section can be clicked to be redirected to the task list and shows you the progress of this process. By default, this section shows the onboarding and integration processes; you must click on Departure to view the departure processes.
The Unapproved requests section shows you all unapproved requests to which you have access. Click on this section to be redirected to the In-Depht Analysis of the module for viewing and approval if required.
The Certificates section presents you with certificates to be renewed in the short term under 3 categories: Expired certificates, To be renewed within 30 days and To be renewed within 31 to 90 days. By default, this section shows expired certificates; to display certificates due for renewal within the next 30 days, click on 30 days, and for those due for renewal within 31 to 90 days, click on 90 days.
The Reminders section shows you reminders for Profile Notes in the Work Accidents and Labor Relations modules. You can view tasks due today, in the next 7 days or in the next 14 days.
Me view
The first section with the yellow rectangles shows you statistics on your available banks in each of the time management modules (Sick, Vacation, Mobile/Personnel and Overtime).
The Today section shows you your day's leave, birthdays and anniversaries. You can change the date displayed for this information by selecting another date in the Calendar.
The Calendar section uses colored dots to display days with one or more of the items in the Today section, in addition to public holidays. By selecting a day other than today, you affect what is shown in the Today section.
The Ongoing processes section shows you the onboarding or offboarding processes in progress, for which you have one or more tasks to complete. This section can be clicked to redirect you to the task list and show you the progress of this process. By default, this section shows onboarding processes; you must click on Departure to view departure processes.
The Unapproved requests section shows you all your unapproved requests. You can click on this section to be redirected to the In-Depht Analysis of the module to view the request.
The Certificates section displays your certificates for short-term renewal under 3 categories: Expired certificates, To renew within 30 days and To renew within 31 to 90 days. By default, this section shows Expired Certificates; to view certificates due for renewal in the next 30 days, click on 30 days, and for those due for renewal in 31 to 90 days, click on 90 days. You can only see these items if you have user rights to access the Certificate Management page.
The Reminders section shows you reminders for Notes to File tasks in the Workers' Compensation and Labor Relations modules. You can view tasks due today, in the next 7 days or in the next 14 days. You can only see these items if you have user rights to view the Detailed Analysis page for these modules.
Rates and Trends - Absences
Go to Reports > KPI > Rates and trends.
Description
This KPI represents the number of absence hours or days for the current month.
💡Tip: Only absences recorded in the Absences module are included in this statistic.
View
You can view the total for each month by hovering your cursor over the desired month in the chart.
Rates and trends - Absenteeism rates
Go to Reports > KPI > Rates and trends.
Description
The absenteeism rate shows the overall trend of absences per month in your company.
The absenteeism rate is calculated as follows:
(Number of hours absent ÷ Number of hours worked during the period) × 100
This rate represents the percentage of working hours that were spent absent rather than being productive at work.
View
You can view the total for each month by hovering your cursor over the desired month in the chart.
Rates and trends - Departures/Turnover
Go to Reports > KPI > Rates and trends.
Description
This KPI represents the total number of departures for the month, including both voluntary and involuntary departures.
💡Tip: Only departures recorded in the Turnover module are included in this statistic.
View
You can view the total for each month by hovering your cursor over the desired month in the chart.
Rates and Trends - Involuntary departures
Go to Reports > KPI > Rates and Trends
Description
This KPI represents involuntary departures for this month.
💡Tip: Only departures where the Voluntary departure box is not checked are included in this statistic.

View
You can view the total for each month by hovering your cursor over the desired month in the chart.

Rates and trends - Overtime rate
Go to Reports > KPI > Rates and trends.
Description
The overtime rate is used to analyze the ratio of overtime hours compared to regular hours worked.
Calculation Method
The overtime rate is calculated as follows:
(Number of overtime hours ÷ Number of regular hours to be worked) × 1000
Visualization
You can view the total for each month by hovering your cursor over the desired month in the chart.
Rates and Trends - Retention Rate (6 months)
You can access this report by going to Reports > KPI > Rates and trends.
1. The retention rate is related to your new employees.
2. The retention rate is calculated as follows: (Number of active employees divided by the Total number of active plus the inactive employees hired since the last 6 months) multiplied by 100.
NOTE:
The number of inactive employees added in the equation is the number of employees with 6 months or less of seniority and have left the company.
3. You can view the total for each month by placing your cursor over the desired month.

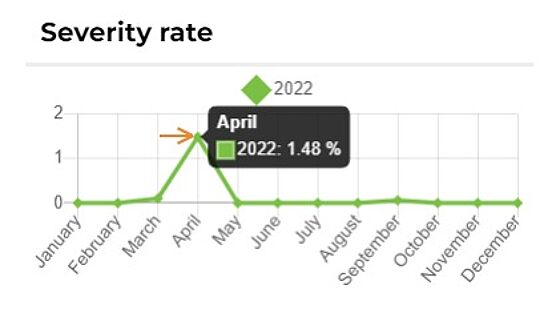
Rates and trends - Severity rate
Go to Reports > KPI > Rates and Trends.
Description
The severity rate allows you to:
Get an overview of serious accidents that occurred within the company.
Assess whether employees are exposed to a high risk of accidents in the workplace.
The severity rate is calculated as follows:
(Number of lost days in the year due to accidents ÷ Number of hours worked in the month) × 1000
Visualization
You can view the total for each month by hovering your cursor over the desired month in the chart.
Rates and trends - Supervision rate
Go to Reports > KPI > Rates and Trends.
Description
The supervisor ratio identifies the proportion of decision-makers compared to performers within the company.
The management ratio is calculated as follows:
(Number of employees listed as supervisors ÷ Total number of active employees) × 100
This represents the percentage of supervisors or managers in the company relative to all employees.
Visualization
You can view the total for each month by hovering your cursor over the desired month in the chart.

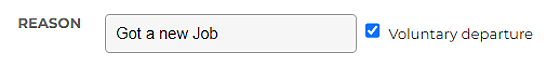
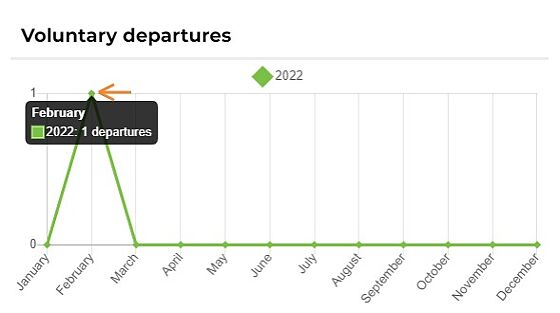
Rates and trends - Voluntary departures
Go to Reports > KPI > Rates and Trends
Description
This KPI represents voluntary departures for this month.
💡Tip: Only departures where the Voluntary departure box is checked are included in this statistic.
View
You can view the total for each month by hovering your cursor over the desired month in the chart.
When are the KPIs calculated?
Calculation Details
The KPIs are always calculated on the last day of the month at midnight.
⚠️Important: once the KPIs have been calculated, it is not recalculated the following month.
If you make a retroactive entry in a month where the KPI has already been calculated, this change will not affect the existing KPI.