It is possible to view multiple years within the statistics charts. To select the number of years to be displayed in the tables, both in the Demographics and the Rates and Trends section, click on the Number of years displayed drop-down.
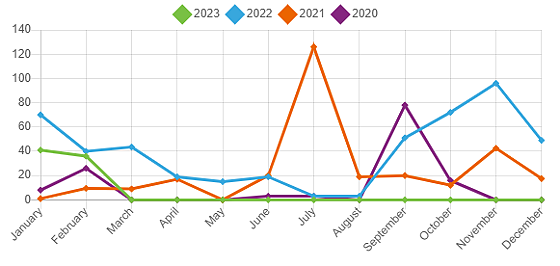
If you select more than one year, the rows of the tables will adjust accordingly with different colors.
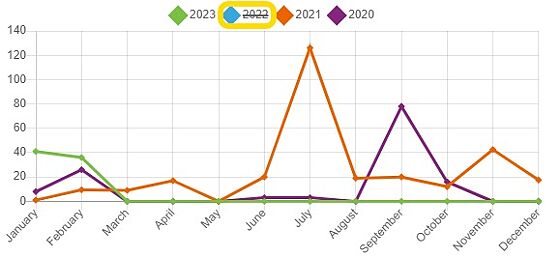
It is possible to hide one or more years. Click on the year(s) to be hidden inside the table and click one more time to display them again.