
Access Reports > KPI > Rates and trends.
Absences
This KPI represents the number of absence hours or days for the current month.
💡Tip: Only absences recorded in the Absences module are included in this statistic.
View
You can view the total for each month by hovering your cursor over the desired month in the chart.
Absenteeism rate
The absenteeism rate shows the overall trend of absences per month in your company.
The absenteeism rate is calculated as follows:
(Number of hours absent ÷ Number of hours worked during the period) × 100
This rate represents the percentage of working hours that were spent absent rather than being productive at work.
View
You can view the total for each month by hovering your cursor over the desired month in the chart.
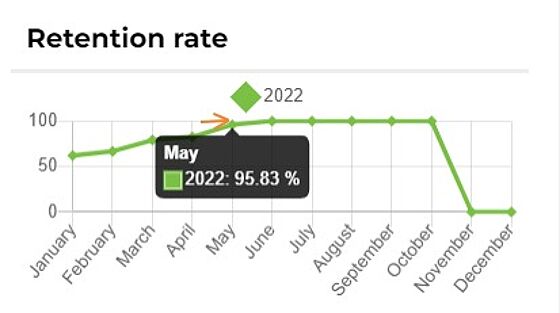
Retention rate (6 months)
1. The retention rate is related to your new employees.
2. The retention rate is calculated as follows: (Number of active employees divided by the Total number of active plus the inactive employees hired since the last 6 months) multiplied by 100.
NOTE:
The number of inactive employees added in the equation is the number of employees with 6 months or less of seniority and have left the company.
3. You can view the total for each month by placing your cursor over the desired month.
Departures
This KPI represents the total number of departures for the month, including both voluntary and involuntary departures.
💡Tip: Only departures recorded in the Turnover module are included in this statistic.
View
You can view the total for each month by hovering your cursor over the desired month in the chart.
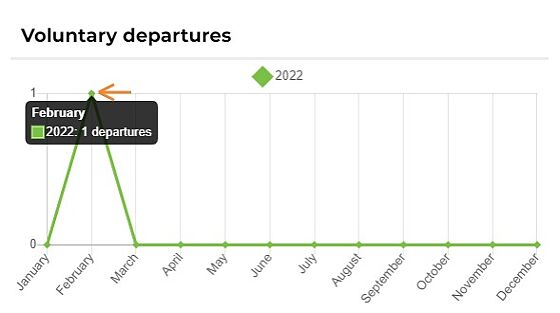
Voluntary departures
This KPI represents voluntary departures for this month.
💡Tip: Only departures where the Voluntary departure box is checked are included in this statistic.

View
You can view the total for each month by hovering your cursor over the desired month in the chart.
Involuntary departures
This KPI represents involuntary departures for this month.
💡Tip: Only departures where the Voluntary departure box is not checked are included in this statistic.

View
You can view the total for each month by hovering your cursor over the desired month in the chart.

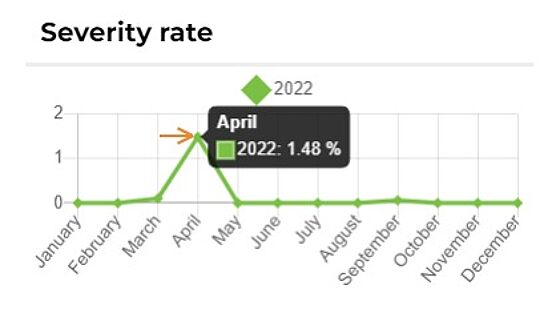
Severity rate
The severity rate allows you to:
Get an overview of serious accidents that occurred within the company.
Assess whether employees are exposed to a high risk of accidents in the workplace.
The severity rate is calculated as follows:
(Number of lost days in the year due to accidents ÷ Number of hours worked in the month) × 1000
Visualization
You can view the total for each month by hovering your cursor over the desired month in the chart.
Overtime rate
The overtime rate is used to analyze the ratio of overtime hours compared to regular hours worked.
Calculation Method
The overtime rate is calculated as follows:
(Number of overtime hours ÷ Number of regular hours to be worked) × 1000
Visualization
You can view the total for each month by hovering your cursor over the desired month in the chart.
Supervision rate
The supervisor ratio identifies the proportion of decision-makers compared to performers within the company.
The management ratio is calculated as follows:
(Number of employees listed as supervisors ÷ Total number of active employees) × 100
This represents the percentage of supervisors or managers in the company relative to all employees.
Visualization
You can view the total for each month by hovering your cursor over the desired month in the chart.